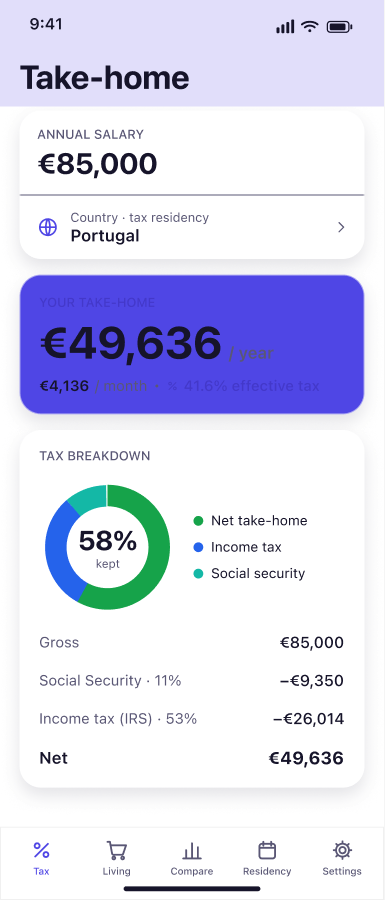
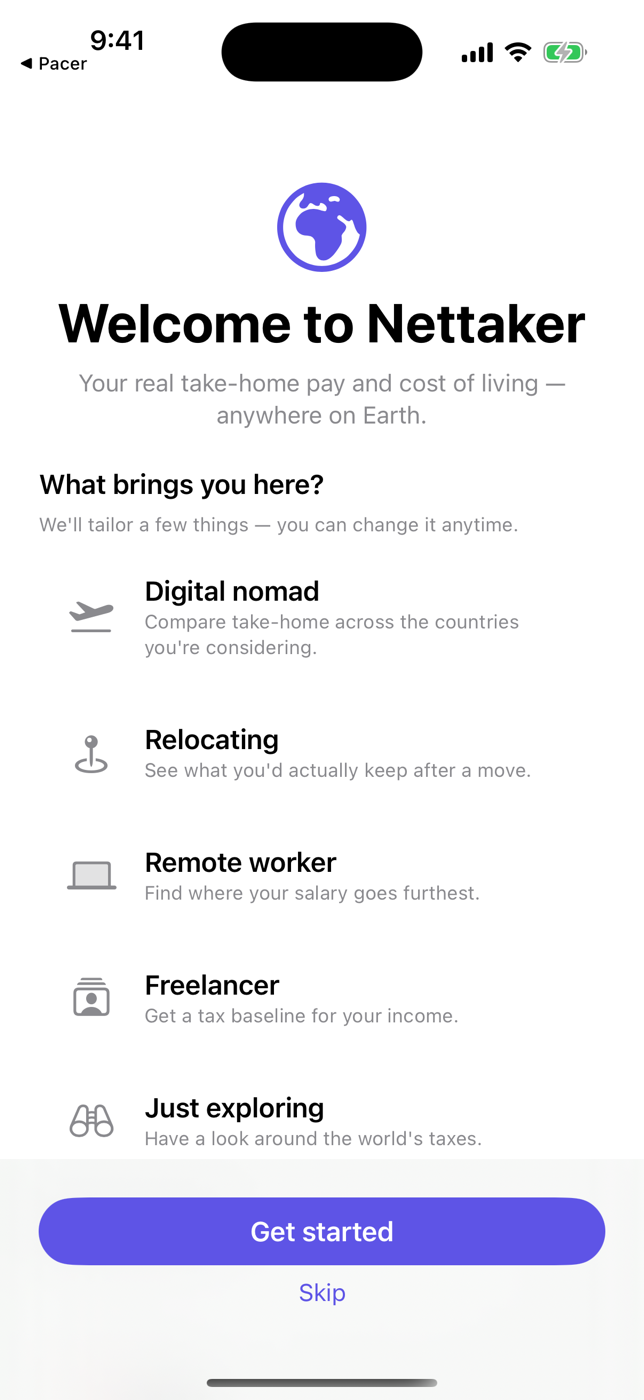
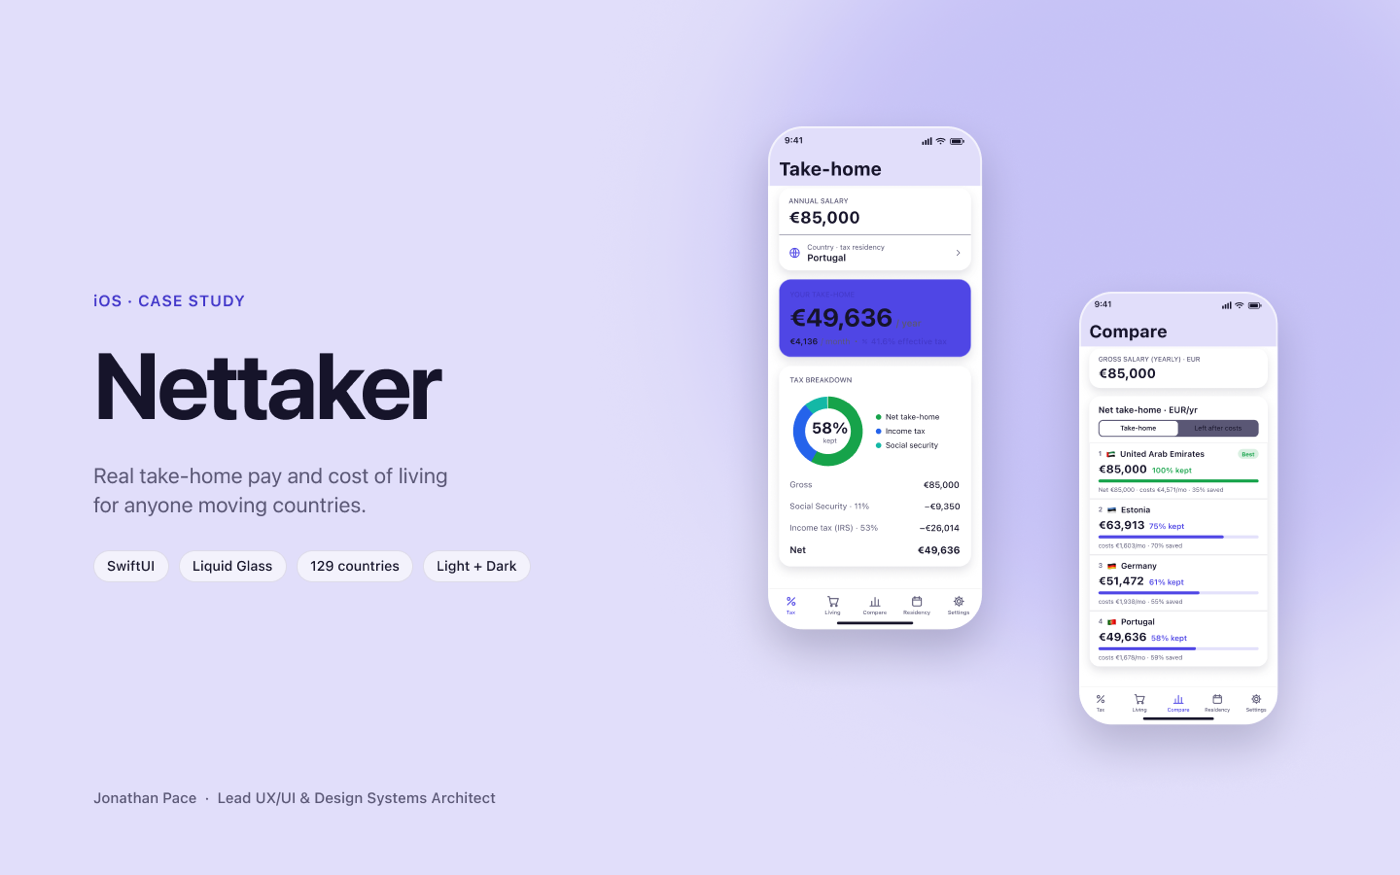
Nettaker is a shipped iOS app — live on the App Store — for digital nomads, freelancers and anyone weighing a move. People compare gross salaries when they should compare what they actually keep. Nettaker takes a salary and a country and returns real net pay, a clear tax breakdown, the local cost of living, and a ranked comparison of destinations: verified, sourced data where it exists, and a clearly-labelled estimate everywhere else, across 129 verified tax models.
The challenge
The real problem was never the calculation — it was decision uncertainty wrapped in financial intimidation. People need to trust a number enough to make a life decision on it, but most tools either oversimplify (and feel untrustworthy) or drown the user in tax jargon (and feel unusable). Neither helps someone actually decide.
- People compare gross salary instead of real take-home
- Tax and social-contribution systems differ wildly by country — brackets, flat rates, zero-tax regimes
- Existing tools are either too basic to trust or too technical to use
- Relocation decisions are high-stakes and emotionally loaded
- Users need confidence, which means seeing enough of the breakdown to believe it
- Cost of living can change the answer as much as tax does
Discovery & research
Before a single screen, the real risk was trust: people don't act on a take-home number they can't believe. Discovery focused on why existing tools fail, what data could be sourced credibly across countries, and how much detail a person actually needs to make a relocation decision with confidence.
Existing tools fail at opposite extremes
Mainstream salary calculators lead with gross or a single headline rate; official tax portals are accurate but bury the answer under jargon and forms. One side is believable-but-useless, the other usable-but-opaque, and neither helps someone decide. That gap defined the brief: a fast, believable answer first, with the evidence available on demand.
EvidenceTeardown of gross-salary calculators, national tax portals, and relocation cost indices (Numbeo-style).
People compare the wrong number
The decision underneath the search — 'would my life actually be better there?' — turns on net pay after tax and social contributions, then on local cost of living. Gross salary, the figure everyone quotes, is the least decision-relevant of the three. The product had to walk the user from gross, to net, to net-after-living-costs.
EvidenceJobs-to-be-done framing of the relocation / remote-work decision.
Trust is the conversion mechanic, and it comes from honesty about the data
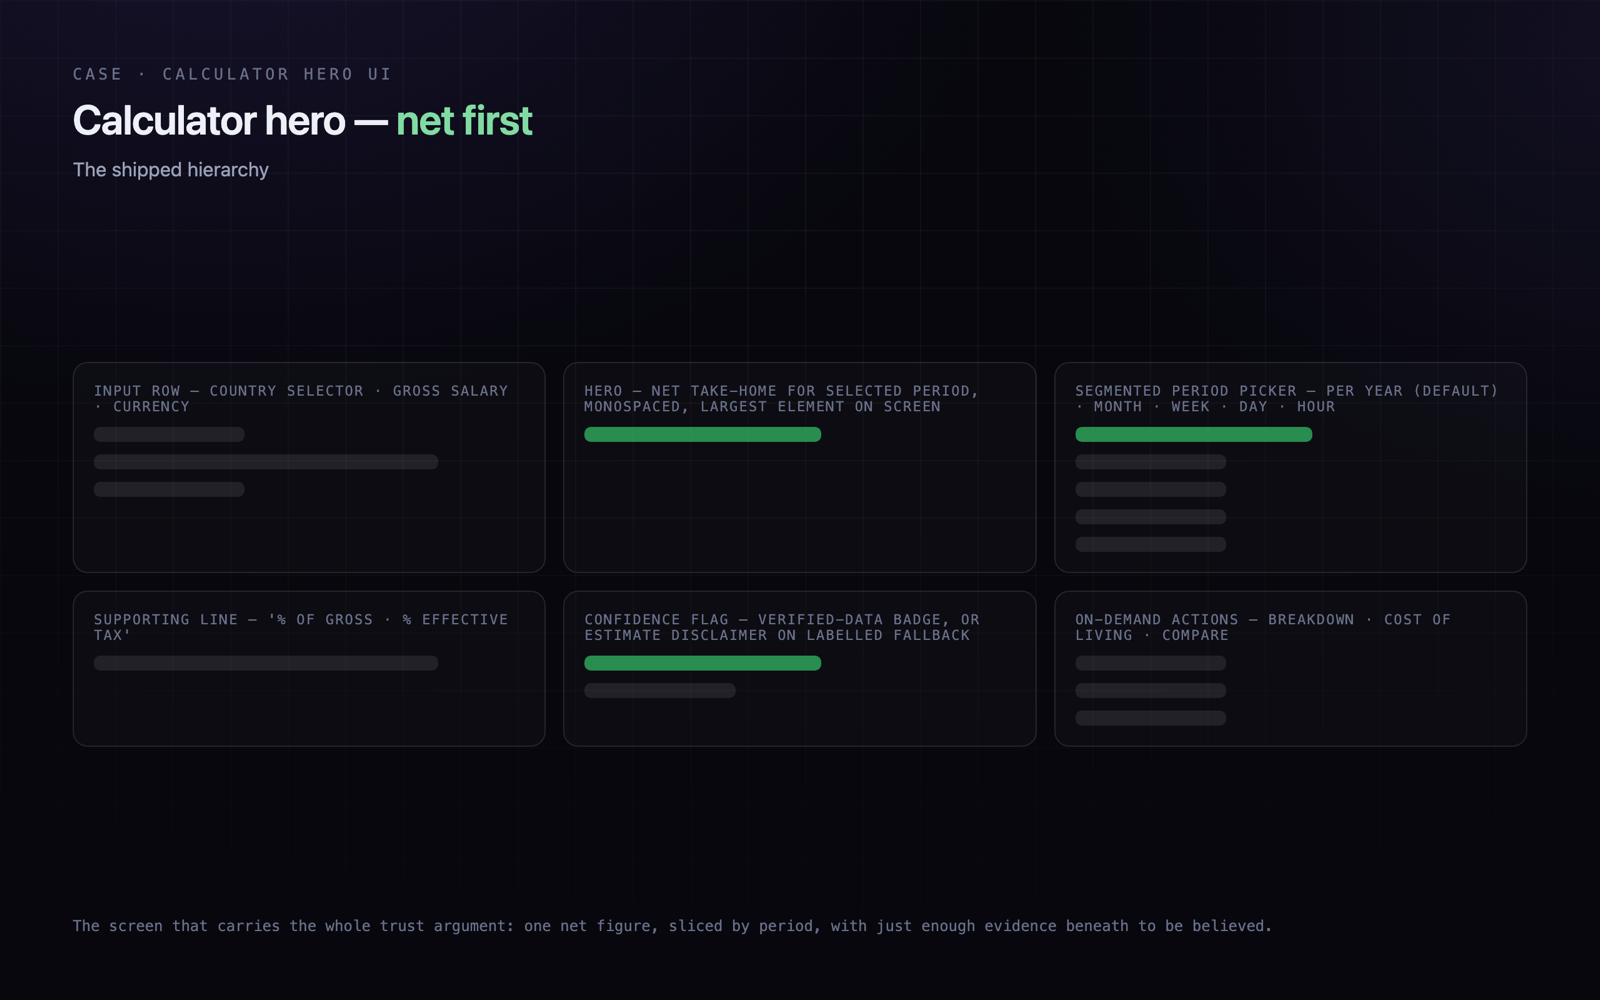
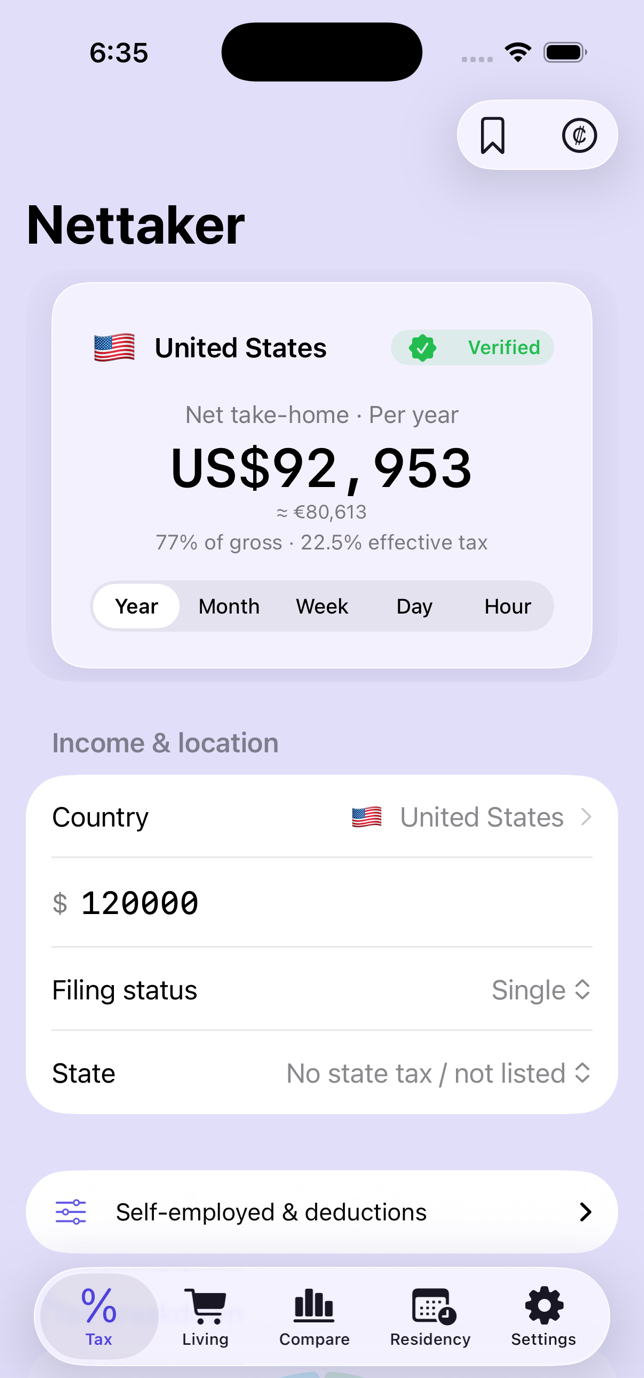
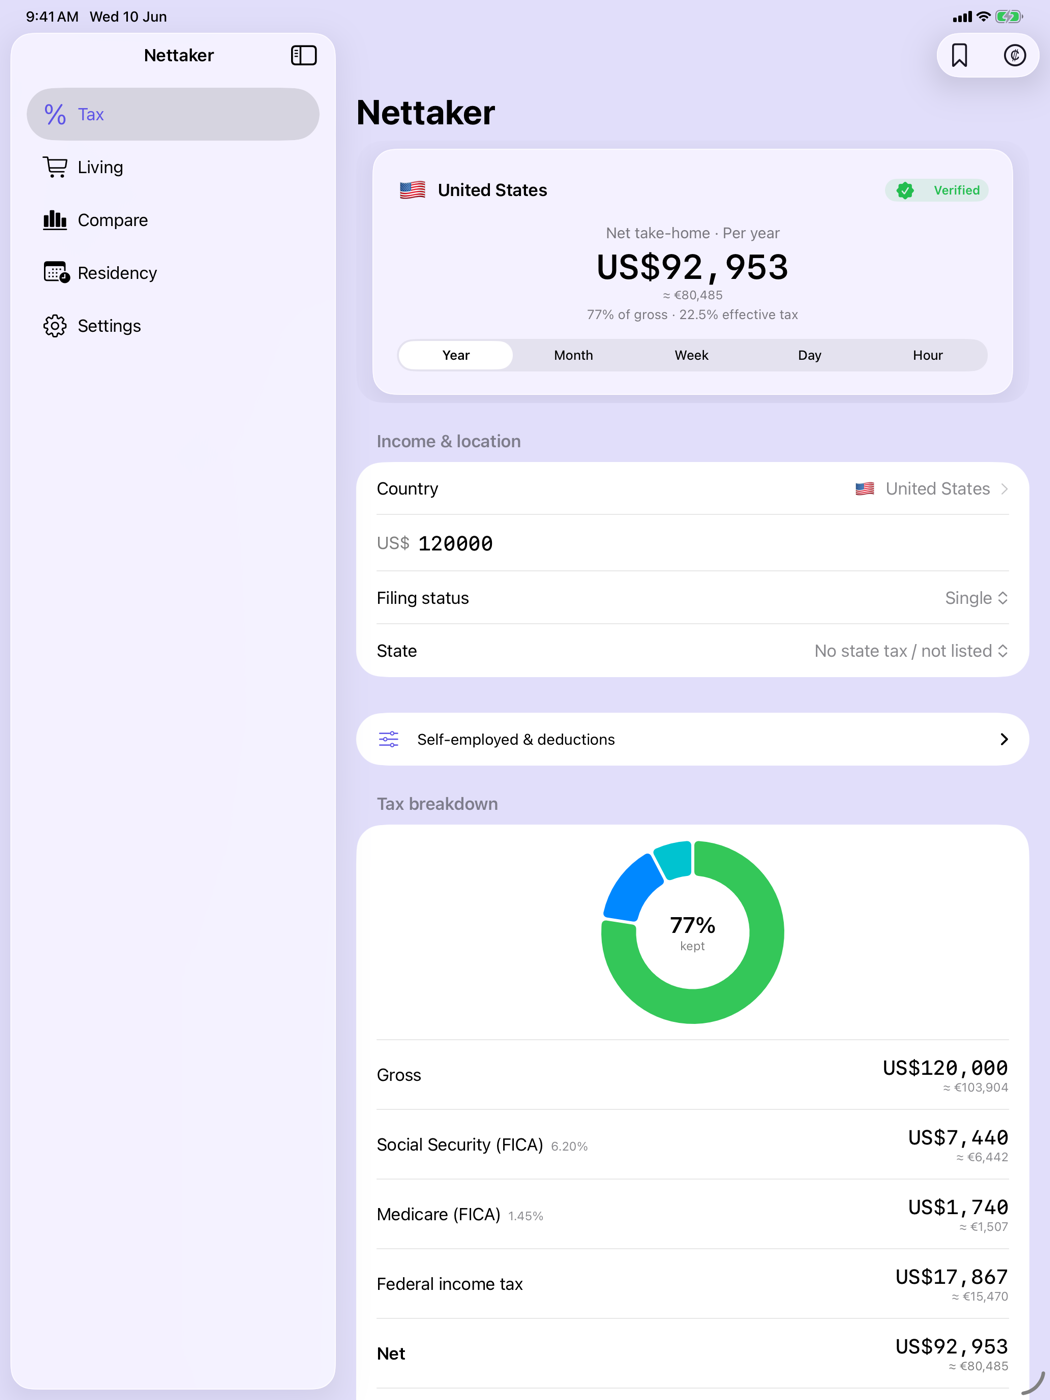
A financial answer a user cannot interrogate is one they will not act on. The conclusion was to make data provenance visible rather than hide it: show verified, sourced models where they exist, and clearly label estimates everywhere else — never a confident-looking number with nothing behind it. Every calculation carries a confidence flag, verified or estimated, surfaced in the UI.
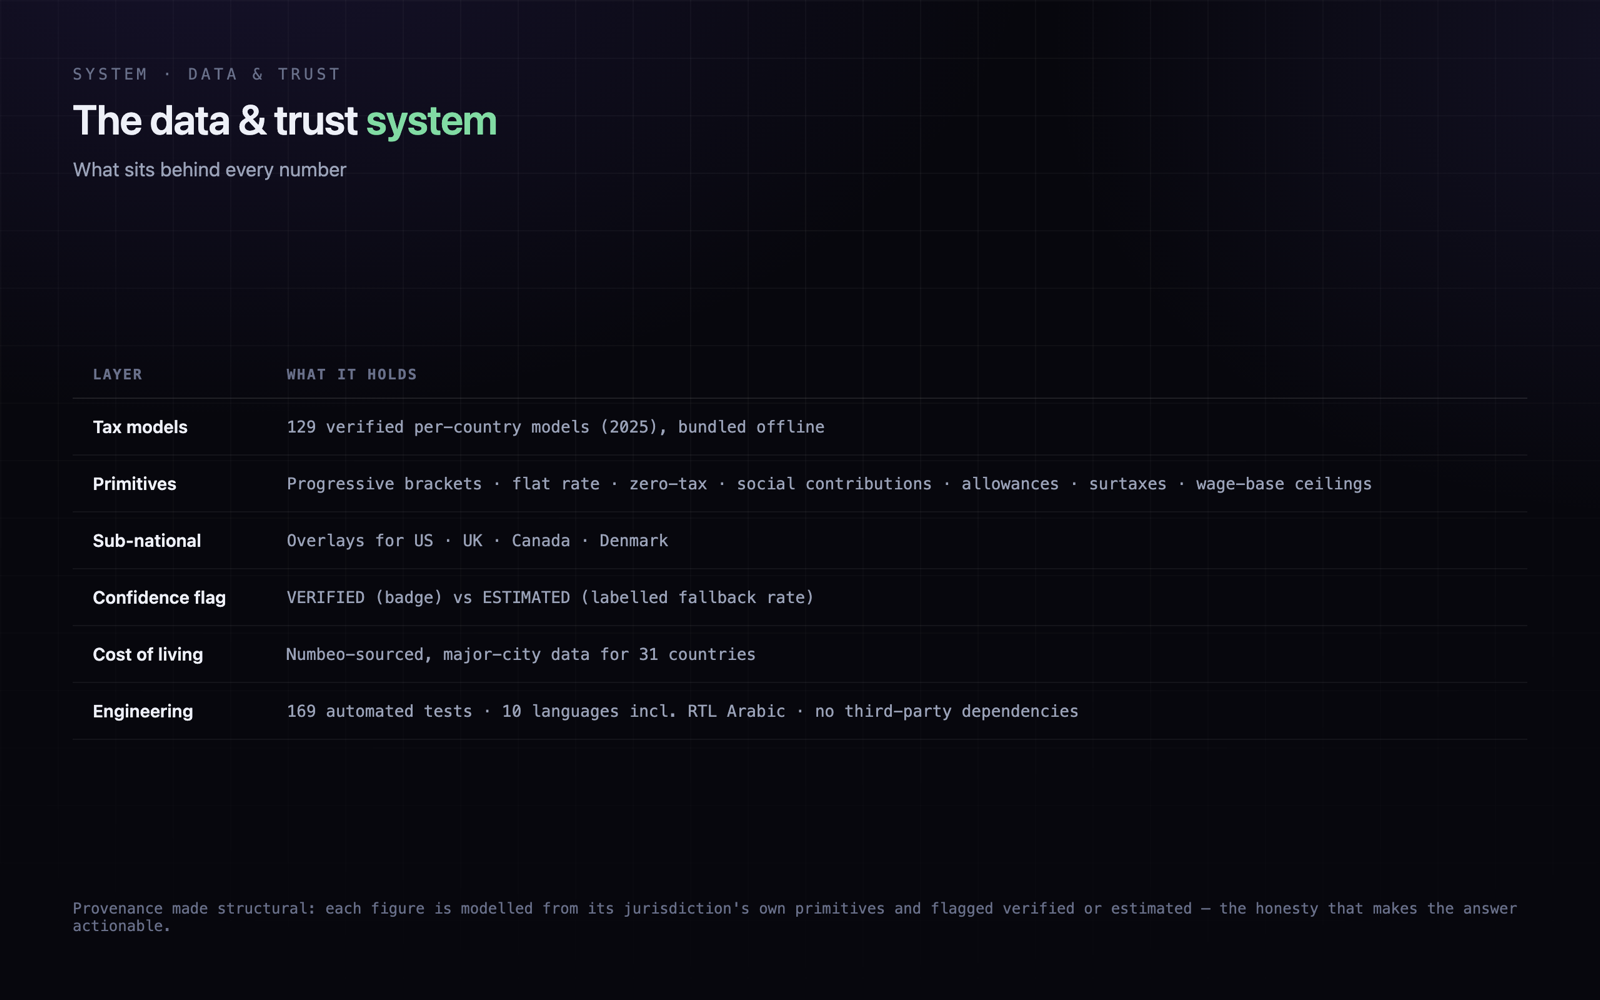
EvidenceShipped as a 129-country registry of verified 2025 tax models plus explicitly labelled estimated-rate fallbacks, surfaced by a verified-data badge and an estimate disclaimer in the UI.
Tax systems do not generalise — each had to be modelled from its own primitives
Brackets, allowances, flat rates, surtaxes, social-contribution rules and wage-base ceilings differ enough that one global formula would be wrong almost everywhere; some jurisdictions are progressive, some flat-rate, some zero-income-tax. Discovery built a per-country data model out of shared primitives instead of an approximation, which set the architecture for the entire calculation engine — including golden-value tests for self-employed and edge-case filings.
EvidencePer-country tax JSON bundled in the app; 129 verified 2025 models; 169 automated tests across the app covering golden values, data validation, cost-of-living and smoke.
Cost of living moves the answer as much as tax does
A higher net salary can still be a worse life if rent and essentials cost more, so 'money kept' had to mean kept after living costs. Cost-of-living context was scoped in from the start as a first-class part of the comparison, not a later add-on, with major-city granularity where the data supported it.
EvidenceNumbeo-sourced cost-of-living model in the product, with major-city data for 31 countries and an optional live-index integration.
How I approached it
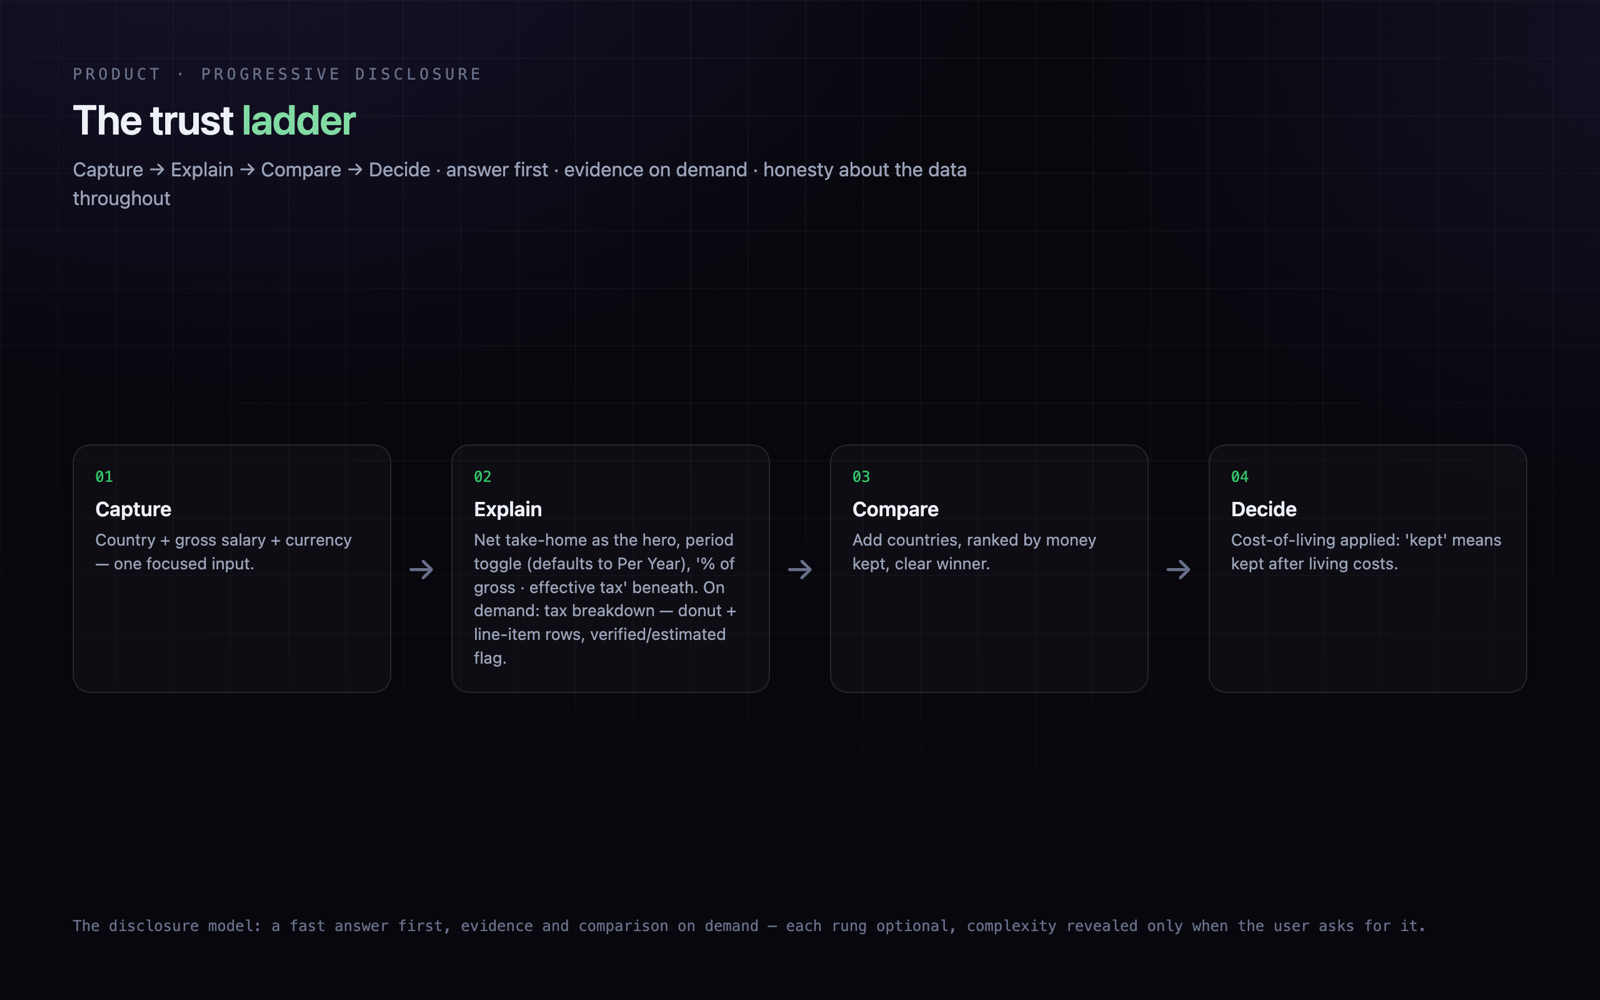
I reframed the calculator around the real job-to-be-done — making a life decision with confidence — and made the net figure the hero. Then I designed the trust ladder: a fast answer first, an honest breakdown on demand, cost-of-living context, and a side-by-side comparison that ranks countries by what you actually keep. Underneath sits a per-country data model where each jurisdiction is modelled from its own primitives — progressive brackets, flat rates, social contributions, allowances, surtaxes and wage-base ceilings — rather than forced through one global formula. The whole thing lives in a calm lavender Liquid-Glass language with monospaced numerals so figures stay legible and stable.
Defined the real decision behind the calculator, not just the formula
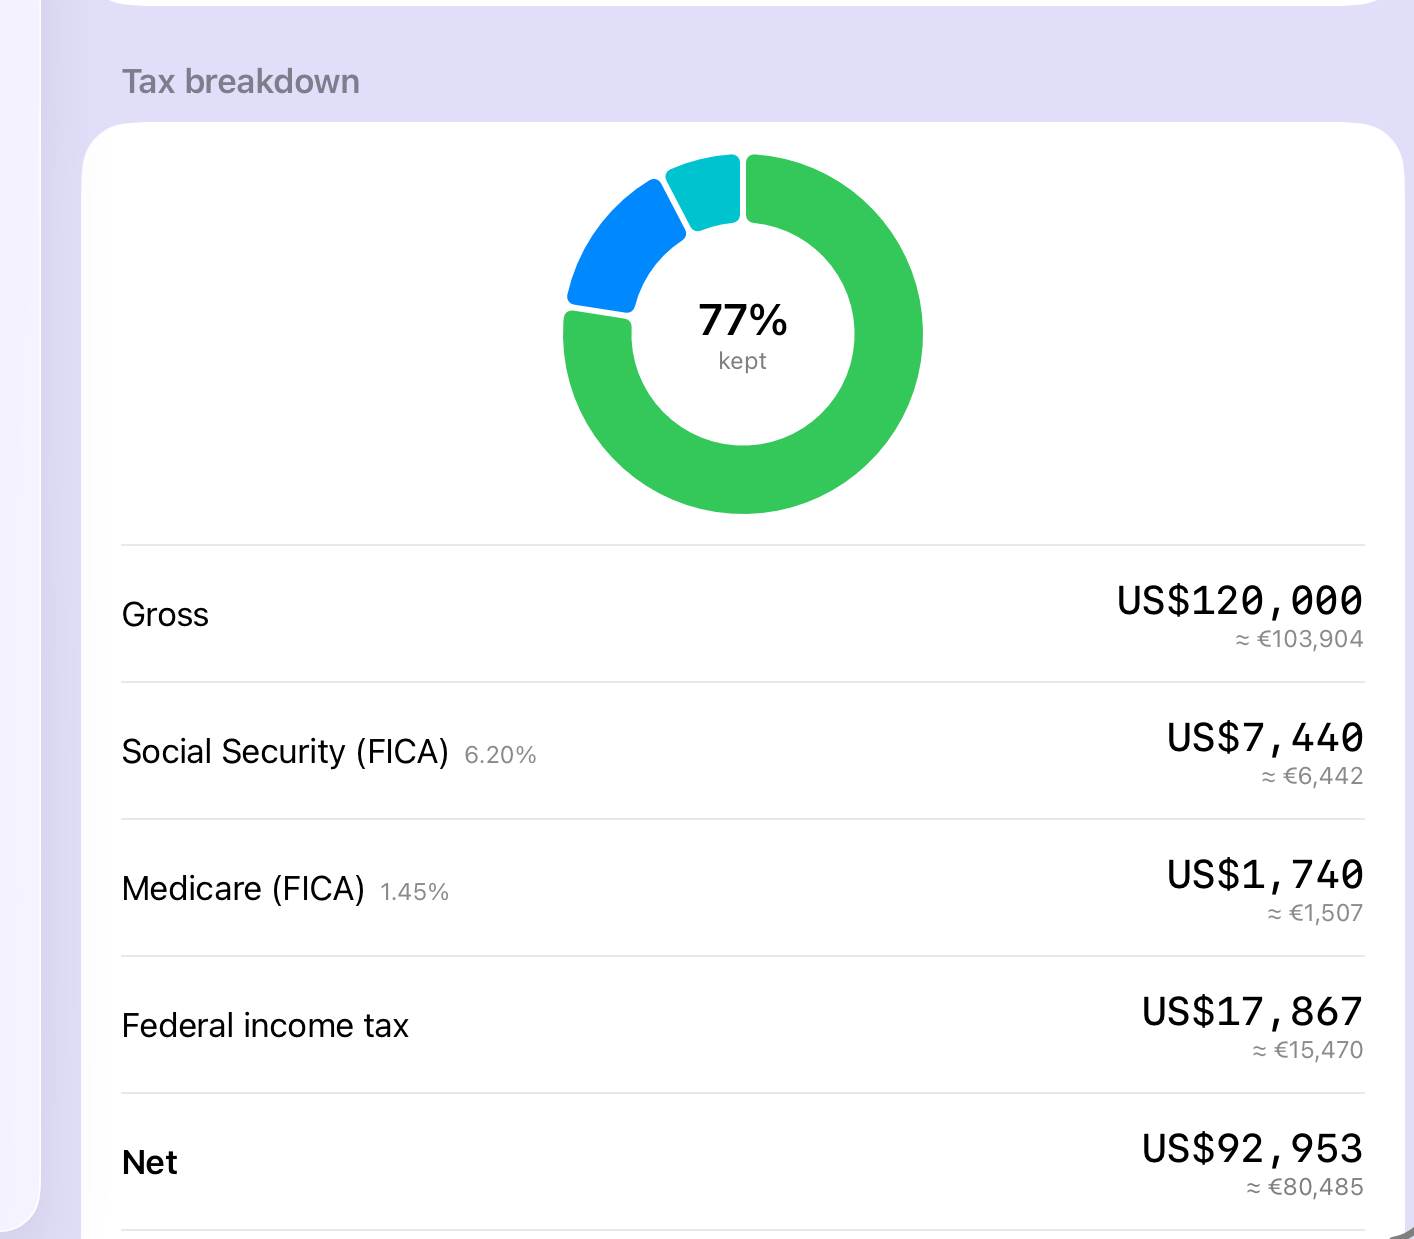
Made net take-home the headline, sliced by a period toggle that defaults to per-year
Designed a tax breakdown (donut + rows) that explains without overwhelming
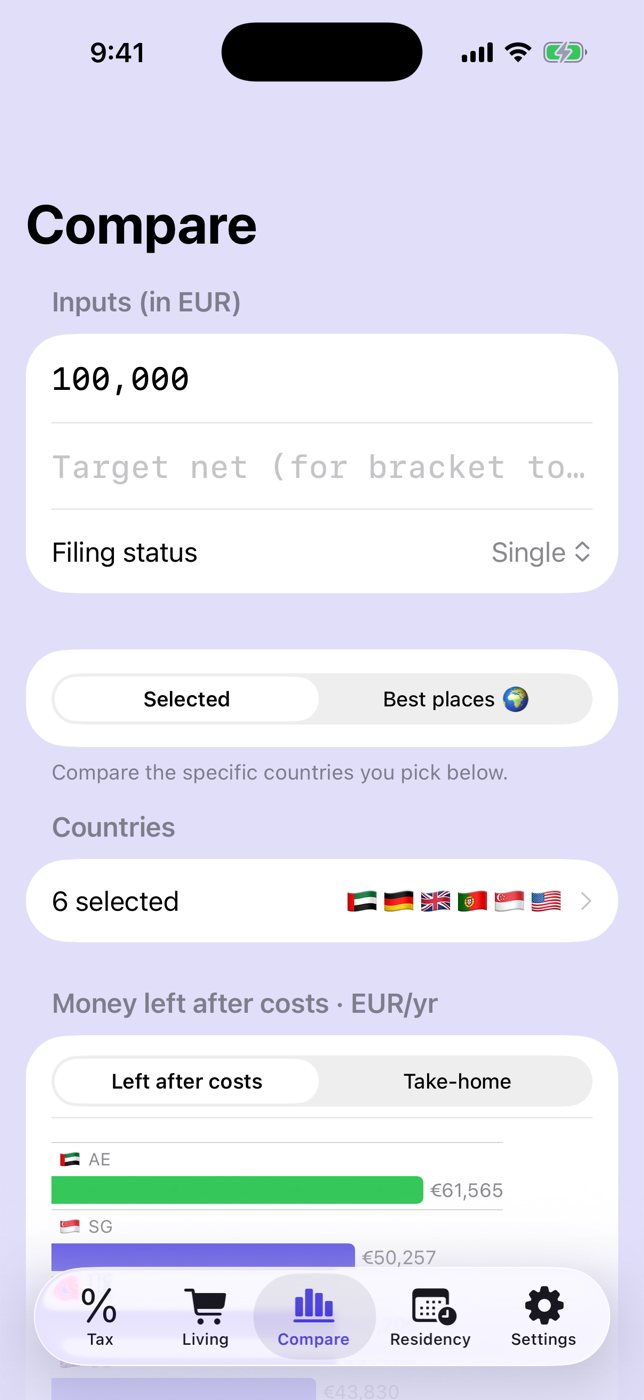
Made country comparison a first-class action, ranked by money kept
Added a cost-of-living model so 'kept' means kept after living costs
Modelled each country from its own tax primitives and flagged every figure verified or estimated
Trade-offs
Trust was the whole game. A financial answer the user does not understand is one they will not act on, but a financial app that explains everything at once is one they will not use. The design had to sequence complexity and signal accuracy — verified versus estimated — without ever posing as formal tax advice, and it had to do that consistently across 129 tax systems that share almost no structure.
- Financial information feels intimidating by default
- Each country has different deduction and contribution logic — brackets, flat rates, zero-tax
- Comparisons must feel simple but stay credible
- Verified vs estimated data has to be unmistakable
- The product must help decide without posing as tax advice
Final direction
The final model is Capture → Explain → Compare → Decide. A focused input returns a fast net figure on a period toggle; the breakdown, cost-of-living and comparison unfold on demand. Compare ranks destinations by take-home — or by money left after living costs — with a clear winner. Every figure is flagged verified or estimated, sub-national overlays refine the answer for the US, UK, Canada and Denmark, and the whole app — lavender Liquid Glass and all — ships localised into ten languages including right-to-left Arabic, with a fully designed dark mode.
Outcomes
Nettaker is live on the App Store — a shipped iOS app, not a prototype. Behind it: 129 verified, sourced tax models (bracket-level where progressive, flat-rate and zero-tax modelled explicitly), a cost-of-living model, sub-national overlays for four countries, ten localisations, no third-party dependencies, and 169 automated tests across the app (golden-value, data-validation, cost-of-living and smoke). The design contribution is a trust model for financial decisions: net-first, honestly sequenced, with verified-versus-estimated made visible.
One system, every screen
People don't need a smaller number. They need a number they can believe.
Clarity is not the absence of complexity. It is the careful sequencing of complexity — answer first, evidence on demand, and honesty about what is verified and what is estimated throughout.